Performance and memory usage comparisons
1. Introduction
In this document, the performance and memory usage of many web servers and Ruby web application containers are compared with Phusion Passenger + Ruby Enterprise Edition.
Note that these results are purely that of our own. If you perform your own benchmarks, then you might find different results. We actually encourage you to perform your own benchmarks.
2. Testing environment
- Hardware
-
- Intel Core 2 Duo, T5300, 1.73 Ghz
- 2 GB RAM
- Software
-
- Ubuntu Linux 7.10, 32-bit
- Ruby 1.8.6 (2007-06-07 patchlevel 36) as provided by Ubuntu
- Ruby on Rails 2.0.2, installed from RubyGems (which, in turn, was installed from source)
- Typo 5.0.3
- "production" environment
- Page caching disabled
- SQLite 3 as database
3. Participants
- Apache (prefork MPM) + Phusion Passenger
-
- Apache 2.2.4 (Ubuntu provided)
- Phusion Passenger development version (May 21, 2008)
- PassengerMaxPoolSize 6
- RailsBaseURI /
- Apache MPM configuration (Ubuntu default):
StartServers           5
MinSpareServers        5
MaxSpareServers       10
MaxClients           150
MaxRequestsPerChild    0
- Apache (worker MPM) + Phusion Passenger
-
- Apache 2.2.8 (built from source)
- Phusion Passenger development version (May 21, 2008)
- RailsBaseURI /
- PassengerMaxPoolSize 6
- Optimized Apache MPM configuration:
StartServers               1
MaxClients                16
MinSpareThreads            1
MaxSpareThreads            3
ThreadsPerChild            1
MaxRequestsPerChild     5000
ThreadStackSize      1000000
- Nginx + Mongrel Cluster
-
- Nginx 0.5.26 (Ubuntu provided)
- Mongrel 1.1.4
- Mongrel_cluster 1.0.5
- 6 cluster servers
- Ubuntu default Nginx configuration:
worker_processes    1;
worker_connections  1024;
- Nginx + Thin
-
- Nginx 0.5.26 (Ubuntu provided)
- Thin 0.8.1, using Unix sockets instead of TCP sockets
- 6 servers
- Ubuntu default Nginx configuration:
worker_processes    1;
worker_connections  1024;
- LiteSpeed
-
- LiteSpeed 3.3.11, free version
- Default settings
- Apache (worker MPM) + Ruby Enterprise Edition + Phusion Passenger
-
- Apache 2.2.8 (built from source)
- Phusion Passenger development version (May 21, 2008)
- PassengerMaxPoolSize 6
- RailsBaseURI /
- Optimized Apache MPM configuration:
StartServers               1
MaxClients                16
MinSpareThreads            1
MaxSpareThreads            3
ThreadsPerChild            1
MaxRequestsPerChild     5000
ThreadStackSize      1000000
4. Test scenario
For each participant, we measure its performance and memory usage as follows:- We first "warm up" the participant by sending 1000 requests with 12
concurrent users to it. This gives the participant the chance to
load whatever resources are necessary.
This is done with the Apache benchmarking tool:
ab -n 1000 -c 12 ...
- Next, we send 20.000 requests in total, using 12 concurrent users.
ab -n 20000 -c 12 ...
- Then, we measure the current system memory usage with the 'free' tool.
- Then, we shutdown the participant (that is, the web server, and (if applicable) the application server).
- Finally, we measure the current system memory usage with the 'free' tool. Other interesting information is also noted. We define the final memory usage of the participant as the difference between the free system memory before and after shutting down the participant.
5. Test results
5.1 Apache (prefork MPM) + Phusion Passenger
Foreword
We ran into an interesting problem while measuring the memory usage of Phusion Passenger: How do we define its memory usage? Phusion Passenger caches Ruby on Rails framework code and application code into spawn servers, for faster startup time. These spawn servers will exit automatically after an idle period, so it's not clear whether we should count the spawn servers' memory usage as well.
We decided that it would probably be best to define memory usage as the average of A and B, where A is the memory usage excluding spawn servers, and B the memory usage including spawn servers.
Benchmark result
Concurrency Level:      12
Time taken for tests:   44.955727 seconds
Complete requests:      20000
Failed requests:        0
Write errors:           0
Total transferred:      111560000 bytes
HTML transferred:       102480000 bytes
Requests per second:    444.88 [#/sec] (mean)
Time per request:       26.973 [ms] (mean)
Time per request:       2.248 [ms] (mean, across all concurrent requests)
Transfer rate:          2423.38 [Kbytes/sec] received

Connection Times (ms)
              min  mean[+/-sd] median   max
Connect:        0    0   0.3      0      14
Processing:     2   26  71.6     12    2682
Waiting:        0   25  69.7     12    2680
Total:          2   26  71.6     12    2682

Percentage of the requests served within a certain time (ms)
  50%     12
  66%     20
  75%     25
  80%     29
  90%     43
  95%     73
  98%    187
  99%    276
 100%   2682 (longest request)
Memory usage after benchmark (passenger-memory-stats)
-------------- Apache processes --------------
PID    PPID   Threads  VMSize   Private  Name
 ---------------------------------------------
1039   26633  1        20.5 MB  1.8 MB   /usr/sbin/fcgi-pm -k start
1044   26633  1        26.8 MB  0.5 MB   /usr/sbin/apache2 -k start
1046   26633  1        26.8 MB  0.4 MB   /usr/sbin/apache2 -k start
1120   26633  1        26.8 MB  0.4 MB   /usr/sbin/apache2 -k start
1457   26633  1        26.8 MB  0.5 MB   /usr/sbin/apache2 -k start
1465   26633  1        26.8 MB  0.4 MB   /usr/sbin/apache2 -k start
1469   26633  1        26.8 MB  0.4 MB   /usr/sbin/apache2 -k start
1470   26633  1        26.8 MB  0.5 MB   /usr/sbin/apache2 -k start
1472   26633  1        26.8 MB  0.4 MB   /usr/sbin/apache2 -k start
1474   26633  1        26.8 MB  0.4 MB   /usr/sbin/apache2 -k start
1476   26633  1        26.8 MB  0.4 MB   /usr/sbin/apache2 -k start
26633  1      1        26.6 MB  0.4 MB   /usr/sbin/apache2 -k start
### Processes: 12
### Total private dirty RSS: 6.82 MB

 ------- Passenger processes ---------
PID   Threads  VMSize   Private  Name
 -------------------------------------
1040  13       8.3 MB   0.5 MB   ApplicationPoolServerExecutable  /tmp/passenger_status.26633.fifo
1042  2        16.2 MB  5.0 MB   Passenger spawn server
1435  1        64.0 MB  29.8 MB  Passenger ApplicationSpawner: /var/www/projects/typo-5.0.3
1439  1        68.0 MB  33.9 MB  Rails: /var/www/projects/typo-5.0.3
1442  1        67.5 MB  33.4 MB  Rails: /var/www/projects/typo-5.0.3
1448  1        67.4 MB  33.2 MB  Rails: /var/www/projects/typo-5.0.3
1450  1        67.5 MB  33.3 MB  Rails: /var/www/projects/typo-5.0.3
1452  1        67.4 MB  33.3 MB  Rails: /var/www/projects/typo-5.0.3
1454  1        67.4 MB  33.2 MB  Rails: /var/www/projects/typo-5.0.3
### Processes: 9
### Total private dirty RSS: 235.70 MB
Memory usage after benchmark (free -m)
             total       used       free     shared    buffers     cached
Mem:          2018       1896        121          0         63       1034
-/+ buffers/cache:        798       1219
Swap:            0          0          0
Memory usage after killing ApplicationSpawner/FrameworkSpawner
             total       used       free     shared    buffers     cached
Mem:          2018       1862        155          0         63       1034
-/+ buffers/cache:        764       1253
Swap:            0          0          0
Memory usage after shutting down Apache
             total       used       free     shared    buffers     cached
Mem:          2018       1639        378          0         63       1034
-/+ buffers/cache:        541       1476
Conclusion
- Requests/sec: 444.88
- Memory usage (including ApplicationSpawner/FrameworkSpawner): 257 MB
- Memory usage (excluding ApplicationSpawner/FrameworkSpawner): 223 MB
- Memory usage (average): 240 MB
5.2 Apache (worker MPM) + Phusion Passenger
Foreword
See the foreword for Apache (prefork MPM) + Phusion Passenger.Benchmark results
Concurrency Level:      12
Time taken for tests:   44.237719 seconds
Complete requests:      20000
Failed requests:        0
Write errors:           0
Total transferred:      110360000 bytes
HTML transferred:       102680000 bytes
Requests per second:    452.10 [#/sec] (mean)
Time per request:       26.543 [ms] (mean)
Time per request:       2.212 [ms] (mean, across all concurrent requests)
Transfer rate:          2436.22 [Kbytes/sec] received

Connection Times (ms)
              min  mean[+/-sd] median   max
Connect:        0    0   0.3      0      15
Processing:     2   25 124.1      7    4356
Waiting:        0   25 123.4      7    4356
Total:          2   25 124.1      7    4356

Percentage of the requests served within a certain time (ms)
  50%      7
  66%     11
  75%     17
  80%     21
  90%     37
  95%     67
  98%    185
  99%    334
 100%   4356 (longest request)
Memory usage after benchmark (passenger-memory-stats)
-------------- Apache processes --------------
PID    PPID   Threads  VMSize   Private  Name
 ---------------------------------------------
25511  1      1        10.8 MB  0.5 MB   httpd -k start
25689  25511  3        13.6 MB  0.4 MB   httpd -k start
25759  25511  3        13.6 MB  0.4 MB   httpd -k start
25762  25511  3        13.6 MB  0.4 MB   httpd -k start
### Processes: 4
### Total private dirty RSS: 1.81 MB

 -------- Passenger processes ---------
PID    Threads  VMSize   Private  Name
 --------------------------------------
25688  6        6.5 MB   0.4 MB   ApplicationPoolServerExecutable
25690  2        16.2 MB  4.9 MB   Passenger spawn server
25699  1        64.0 MB  29.8 MB  Passenger ApplicationSpawner: /var/www/projects/typo-5.0.3
25738  1        67.5 MB  33.3 MB  Rails: /var/www/projects/typo-5.0.3
25740  1        67.5 MB  33.3 MB  Rails: /var/www/projects/typo-5.0.3
25742  1        67.3 MB  33.2 MB  Rails: /var/www/projects/typo-5.0.3
25744  1        67.5 MB  33.4 MB  Rails: /var/www/projects/typo-5.0.3
25746  1        67.5 MB  33.4 MB  Rails: /var/www/projects/typo-5.0.3
25748  1        67.5 MB  33.4 MB  Rails: /var/www/projects/typo-5.0.3
### Processes: 9
### Total private dirty RSS: 235.12 MB
Memory usage after benchmark (free -m)
             total       used       free     shared    buffers     cached
Mem:          2018       1962         55          0         34       1066
-/+ buffers/cache:        861       1156
Swap:            0          0          0
Memory usage after killing ApplicationSpawner/FrameworkSpawner
             total       used       free     shared    buffers     cached
Mem:          2018       1914        104          0         34       1066
-/+ buffers/cache:        812       1205
Swap:            0          0          0
Memory usage after shutting down Apache
             total       used       free     shared    buffers     cached
Mem:          2018       1700        318          0         34       1066
-/+ buffers/cache:        598       1419
Swap:            0          0          0
Conclusion
- Requests/sec: 452.10
- Memory usage (including ApplicationSpawner/FrameworkSpawner): 263 MB
- Memory usage (excluding ApplicationSpawner/FrameworkSpawner): 214 MB
- Memory usage (average): 238.5 MB
5.3 Nginx + Mongrel Cluster
Benchmark results
Concurrency Level:      16
Time taken for tests:   56.369300 seconds
Complete requests:      20000
Failed requests:        0
Write errors:           0
Total transferred:      108940000 bytes
HTML transferred:       102760000 bytes
Requests per second:    354.80 [#/sec] (mean)
Time per request:       45.095 [ms] (mean)
Time per request:       2.818 [ms] (mean, across all concurrent requests)
Transfer rate:          1887.30 [Kbytes/sec] received

Connection Times (ms)
              min  mean[+/-sd] median   max
Connect:        0    0   0.3      0      18
Processing:     3   44  54.1     31     515
Waiting:        0   44  54.1     30     515
Total:          3   44  54.1     31     515

Percentage of the requests served within a certain time (ms)
  50%     31
  66%     40
  75%     49
  80%     57
  90%     94
  95%    138
  98%    241
  99%    308
 100%    515 (longest request)
Memory usage after benchmark
             total       used       free     shared    buffers     cached
Mem:          2018       1706        312          0         34        949
-/+ buffers/cache:        722       1295
Swap:            0          0          0
Memory usage after shutting down Mongrel Cluster
             total       used       free     shared    buffers     cached
Mem:          2018       1480        537          0         34        949
-/+ buffers/cache:        496       1521
Swap:            0          0          0
Memory usage after shutting down Nginx
             total       used       free     shared    buffers     cached
Mem:          2018       1478        539          0         34        949
-/+ buffers/cache:        495       1523
Swap:            0          0          0
Conclusion
- Requests/sec: 354.80
- Memory usage: 227 MB
5.4 Nginx + Thin
Benchmark results
Concurrency Level:      16
Time taken for tests:   43.667922 seconds
Complete requests:      20000
Failed requests:        0
Write errors:           0
Total transferred:      108500000 bytes
HTML transferred:       102640000 bytes
Requests per second:    458.00 [#/sec] (mean)
Time per request:       34.934 [ms] (mean)
Time per request:       2.183 [ms] (mean, across all concurrent requests)
Transfer rate:          2426.43 [Kbytes/sec] received

Connection Times (ms)
              min  mean[+/-sd] median   max
Connect:        0    0   0.7      0      17
Processing:     3   34  50.3     23     585
Waiting:        0   33  49.7     23     583
Total:          3   34  50.3     24     585

Percentage of the requests served within a certain time (ms)
  50%     24
  66%     31
  75%     37
  80%     42
  90%     59
  95%     81
  98%    179
  99%    345
 100%    585 (longest request)
Memory usage after benchmark
             total       used       free     shared    buffers     cached
Mem:          2018       1714        304          0         34        967
-/+ buffers/cache:        711       1306
Swap:            0          0          0
Memory usage after shutting down Thin
             total       used       free     shared    buffers     cached
Mem:          2018       1487        530          0         34        967
-/+ buffers/cache:        485       1532
Swap:            0          0          0
Memory usage after shutting down Nginx
             total       used       free     shared    buffers     cached
Mem:          2018       1485        532          0         35        967
-/+ buffers/cache:        483       1534
Swap:            0          0          0
Conclusion
- Requests/sec: 458.00
- Memory usage: 228 MB
5.5 Litespeed
Foreword
It was hard to measure the correct request processing speed and memory usage. LiteSpeed spawns and kills Rails instances very quickly (within intervals of a few seconds). We measured a pretty high memory usage, but if you measure it yourself, then you will most likely find significantly different results, depending on your exact timing.Benchmark results
Concurrency Level:      16
Time taken for tests:   42.550796 seconds
Complete requests:      20000
Failed requests:        0
Write errors:           0
Total transferred:      108520000 bytes
HTML transferred:       102720000 bytes
Requests per second:    470.03 [#/sec] (mean)
Time per request:       34.041 [ms] (mean)
Time per request:       2.128 [ms] (mean, across all concurrent requests)
Transfer rate:          2490.58 [Kbytes/sec] received

Connection Times (ms)
              min  mean[+/-sd] median   max
Connect:        0    0   0.0      0       1
Processing:     6   33 233.0     16   12406
Waiting:        5   32 228.4     16   12405
Total:          7   33 233.0     16   12406

Percentage of the requests served within a certain time (ms)
  50%     16
  66%     20
  75%     23
  80%     26
  90%     37
  95%     56
  98%    102
  99%    181
 100%  12406 (longest request)
Memory usage after benchmark
             total       used       free     shared    buffers     cached
Mem:          2018       1858        159          0         36       1001
-/+ buffers/cache:        820       1197
Swap:            0          0          0
Number of RailsRunner.rb processes immediately after benchmark
11Memory usage after shutting down LiteSpeed
             total       used       free     shared    buffers     cached
Mem:          2018       1524        493          0         36       1003
-/+ buffers/cache:        483       1534
Swap:            0          0          0
Conclusion
- Requests/sec: 470.03
- Memory usage: 334 MB
5.6 Apache (worker MPM) + Ruby Enterprise Edition + Phusion Passenger
Benchmark results
Concurrency Level:      12
Time taken for tests:   35.442032 seconds
Complete requests:      20000
Failed requests:        0
Write errors:           0
Total transferred:      110360000 bytes
HTML transferred:       102680000 bytes
Requests per second:    564.30 [#/sec] (mean)
Time per request:       21.265 [ms] (mean)
Time per request:       1.772 [ms] (mean, across all concurrent requests)
Transfer rate:          3040.82 [Kbytes/sec] received

Connection Times (ms)
              min  mean[+/-sd] median   max
Connect:        0    0   0.3      0      14
Processing:     2   20  41.7     13    1235
Waiting:        0   19  41.1     12    1234
Total:          2   20  41.7     13    1235

Percentage of the requests served within a certain time (ms)
  50%     13
  66%     18
  75%     22
  80%     25
  90%     35
  95%     52
  98%    114
  99%    177
 100%   1235 (longest request)
Memory usage after benchmark (passenger-memory-stats)
-------------- Apache processes --------------
PID    PPID   Threads  VMSize   Private  Name
 ---------------------------------------------
26159  1      1        10.8 MB  0.5 MB   httpd -k restart
26233  26159  3        13.6 MB  0.4 MB   httpd -k restart
26240  26159  3        13.6 MB  0.4 MB   httpd -k restart
26349  26159  3        13.6 MB  0.4 MB   httpd -k restart
### Processes: 4
### Total private dirty RSS: 1.78 MB

 -------- Passenger processes ---------
PID    Threads  VMSize   Private  Name
 --------------------------------------
26163  6        10.3 MB  0.7 MB   ApplicationPoolServerExecutable
26164  1        10.4 MB  4.0 MB   Passenger spawn server
26180  1        55.6 MB  17.5 MB  Passenger ApplicationSpawner: /var/www/projects/typo-5.0.3
26254  1        58.6 MB  20.7 MB  Rails: /var/www/projects/typo-5.0.3
26256  1        58.6 MB  20.7 MB  Rails: /var/www/projects/typo-5.0.3
26258  1        58.6 MB  20.7 MB  Rails: /var/www/projects/typo-5.0.3
26260  1        58.6 MB  20.7 MB  Rails: /var/www/projects/typo-5.0.3
26262  1        58.6 MB  20.7 MB  Rails: /var/www/projects/typo-5.0.3
26264  1        58.6 MB  20.7 MB  Rails: /var/www/projects/typo-5.0.3
### Processes: 9
### Total private dirty RSS: 146.20 MB
Memory usage after benchmark (free -m)
             total       used       free     shared    buffers     cached
Mem:          2018       1914        103          0         36       1102
-/+ buffers/cache:        775       1242
Swap:            0          0          0
Memory usage after killing ApplicationSpawner/FrameworkSpawner
             total       used       free     shared    buffers     cached
Mem:          2018       1897        120          0         36       1102
-/+ buffers/cache:        758       1259
Swap:            0          0          0
Memory usage after shutting down Apache
             total       used       free     shared    buffers     cached
Mem:          2018       1742        275          0         36       1102
-/+ buffers/cache:        604       1414
Swap:            0          0          0
Conclusion
- Requests/sec: 564.30
- Memory usage (including ApplicationSpawner/FrameworkSpawner): 172 MB
- Memory usage (excluding ApplicationSpawner/FrameworkSpawner): 155 MB
- Memory usage (average): 163.5 MB
6. Overall conclusion
| Participant | Speed (requests/sec) | Memory usage (average, MB) |
|---|---|---|
| Apache (prefork MPM) + Phusion Passenger | 444.88 | 240.0 |
| Apache (worker MPM) + Phusion Passenger | 452.10 | 238.5 |
| Nginx + Mongrel Cluster | 354.80 | 227.0 |
| Nginx + Thin | 458.0 | 228.0 |
| LiteSpeed | 470.03 | 334.0 |
| Apache (worker MPM) + Ruby Enterprise Edition + Phusion Passenger |
564.30 | 163.5 |
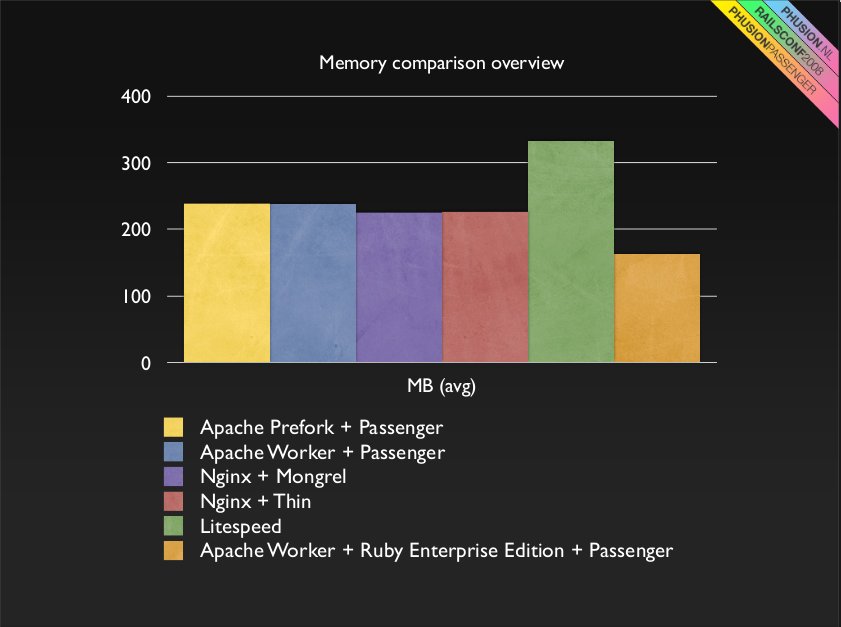
Memory usage comparison diagram - click for larger version
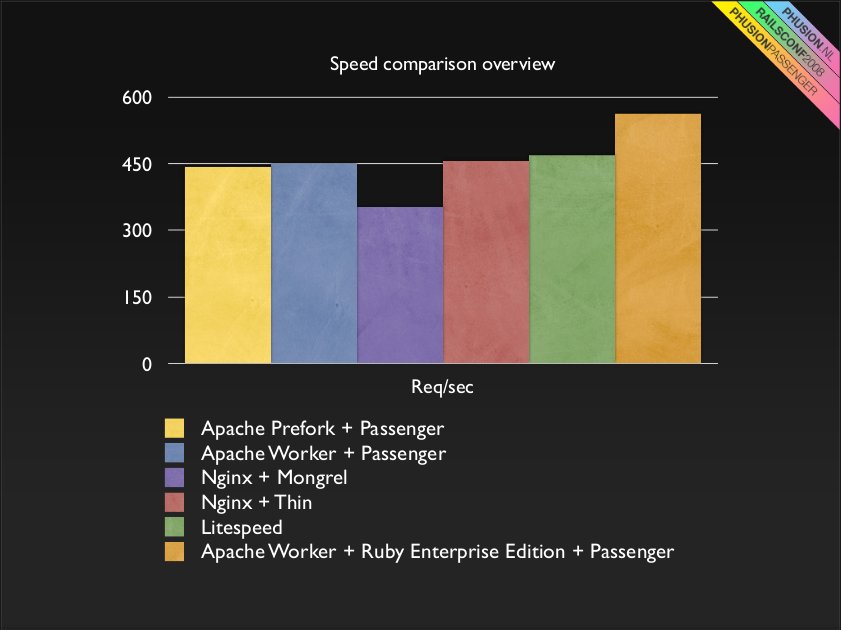
Speed comparison diagram - click for larger version